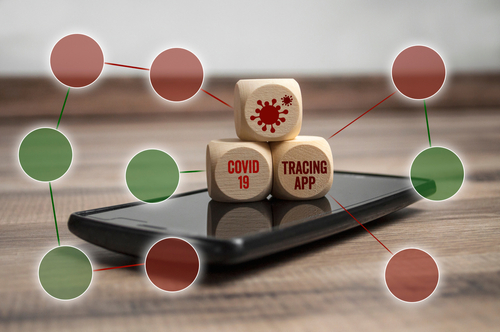
Every county in the United States was scoured for COVID-19 hotspots in a recent study released by University of Utah geographers, providing localized data to track infection clusters and inform local public health policies.
Through space-time statistics, the researchers determined geographic areas where populations had elevated risks of contracting the virus. Based on analyses run daily from Jan. 22 to June 5, these usually trended toward smaller, more numerous clusters after their initial, large scale debut. The shift happened on April 25 and has persisted.
“We applied a clustering method that identifies areas of concern, and also tracks characteristics of the clusters–are they growing or shrinking, what is the population density like, is relative risk increasing or not?” Alexander Hohl, lead author and assistant professor at the university’s Department of Geography, said. “We hope this can offer insights into the best strategies for controlling the spread of COVID-19, and to potentially predict future hotspots.”
Hohl and his team looked to daily case counts reported in the COVID-19 Data Repository from the Johns Hopkins University Center for Systems Science and Engineering for their research, cross-referencing it against the U.S. Census website’s 2018 five-year population estimates county by county. This is where the space-time statistics entered in, establishing clusters by assessing both the observed number of cases and the underlying populations in given geographic areas and timespans.
Through SatScan software, they identified areas of greater risk, though there were limitations. COVID-19 reporting and testing efforts vary by state.
However, this data is now publicly available through COVID19scan.net, a web application that updates daily. That app, said Hohl, is just a start, meant to help state officials prioritize their efforts. It should not be used by people to determine where they will or will not contract SARS-CoV-2, the virus which causes COVID-19.
“I see this more as an inspiration, rather than a concrete tool, to guide authorities to prevent or respond to outbreaks. It also gives the public a way to see what we’re doing,” Hohl said.
The results of the study were published in Spatial and Spatio-temporal Epidemiology. It is the third study the research group has created using this particular statistical method to monitor COVID-19 clusters.


